
It can be fun looking at the large amounts of data and seeing if you can figure out a pattern that may stick out as a new trend. These new patterns can indicate major changes in buyer’s behavior which could have substantial effect on manufacturers.

Recently, the Diesel Technology Forum worked with R.L. Polk and Company to gather the latest registration data from all of the states. Diesel Technology Forum has just release the top ten list on a number of groups, Total Diesel Passenger Vehicles, Fastest Growing, Total Diesel Pickup, Total Diesel Cars and SUB’s and some hybrid stuff.
“Diesel car registrations are up 30 percent since 2010 while the overall market only increased 3.6 percent, said Allen Schaeffer, Executive Director of the Diesel Technology Forum. This is certainly a good sign. As more new vehicles are entering the marketplace with a diesel option, if consumers continue to gravitate towards these power plants, the hopefully manufacturers will continue to develop more offering for their future vehicles.
Fastest Growth All Diesel Passenger Vehicles 2012-2013

| State | % Increase | |
|---|---|---|
| 1 | North Dakota | +24.12% |
| 2 | District of Columbia | +15.94% |
| 3 | Illinois | +13.62% |
| 4 | Delaware | +10.21% |
| 5 | Idaho | +8.55% |
| 6 | New Jersey | +8.54% |
| 7 | Ohio | +8.33% |
| 8 | South Dakota | +8.01% |
| 9 | Texas | +8.00% |
| 10 | Arizona | +7.68% |
(Source of all rankings: R.L. Polk and Company, May 2014 for the Diesel Technology Forum)
It was particularly interesting which states showed up in the top of the fastest growing list. Topping the list was North Dakota, which may seem surprising at first, but when you think about what is going on up there, it becomes quite clear. They are experiencing a huge oil boom and anyone working in that industry is probably driving a diesel truck, not to mention all of the people who have moved up there in the oil industry!
Coming in second is the District of Columbia at 15 almost 16 percent growth. Anyone who has been to D.C. probably doesn’t remember seeing a ton of trucks, so what gives? Well, most of the people that live in D.C. are politician and they must be very conscious of their public appearance. So, driving around in a trendy, high fuel efficient vehicle will reflect well on them when they start looking for supporters come re-election time. (Our question is how many refueling stations offer diesel?) This can potentially indicate that the public opinion towards diesel has or is changing. Perhaps more people are now associating them with high fuel efficiency, good torque producing engines, as opposed to the loud, sooty engines of the 80’s that nearly eliminated diesel offerings all together!

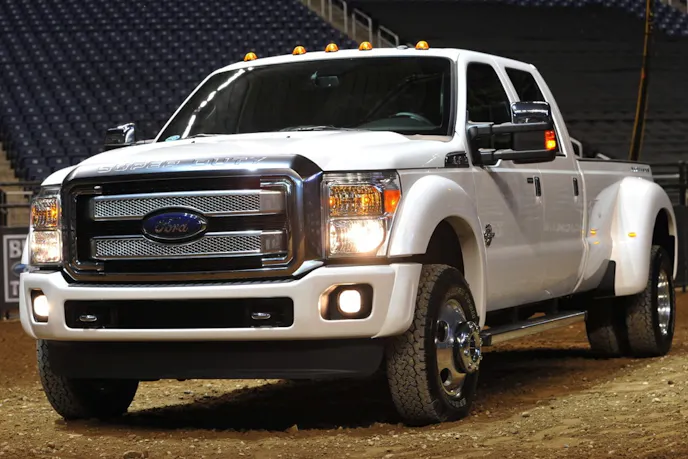
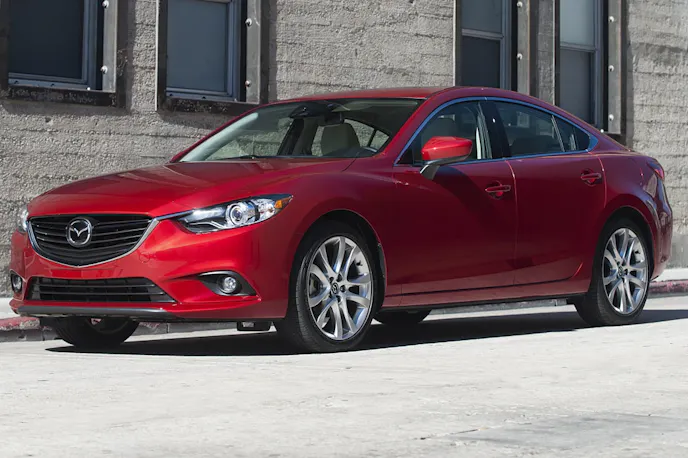
{link=https://www.autotrader.com/research/research/SearchResults.jsp?keywords_display=top-6-diesel-powered-new-cars&keywordsrep=116111112045054045100105101115101108045112111119101114101100045110101119045099097114115&keywordsrc=__dG9wLTYtZGllc2VsLXBvd2VyZWQtbmV3LWNhcnM%2C__&searchtext=top-6-diesel-powered-new-cars&x=32&y=10&page_offset=1&srpSearch=search_from_landing&pageNum=1}AutoTrader{/link} recently did an article listing the top 6 diesel vehicles (all of the vehicles listed here.)
Certainly, one of the biggest surprises to us, is that the largest state when it comes to diesel registration, is also, experiencing a huge increase in diesel vehicle registration. Keep in mind, if your state has 80,000 vehicles and 800 people buy a diesel, then there is a 1 percent increase, but if you are a state with 800,000 diesels, then you need 8,000 diesels. With Texas coming in number 9 overall, it is quite impressive and really shows their comfort level with the diesel.
Below is a list of the top diesel results Diesel Technology Forum results (click here to see hybrid results). See what type of information you can extrapolate!

| Total Diesel Passenger Vehicles 2013 | |||
|---|---|---|---|
| State | Diesels | Hybrids | |
| 1 | Texas | 837,426 | 153,557 |
| 2 | California | 609,212 | 698,560 |
| 3 | Florida | 314,228 | 150,885 |
| 4 | Washington | 245,306 | 103,429 |
| 5 | Pennsylvania | 226,574 | 86,499 |
| 6 | Colorado | 198,906 | 56,869 |
| 7 | North Carolina | 197,305 | 77,943 |
| 8 | Ohio | 191,924 | 69,739 |
| 9 | Georgia | 189,018 | 76,168 |
| 10 | Oregon | 188,976 | 59,465 |
| National Totals | 7,068,439 | 2,826,885 | |
|
|
||||||||||||||||||||||||||||||||||||||||||||||||||||||||||||||||||||||||||||||
You might also like
Sketchy Towing? RoadActive Suspension Fixes This Ford F-250 Super Duty's Squat
This RAS installation levels a squatting Ford F-250. The RoadActive Suspension upgrade stabilizes the ride for heavy towing duties.

